The Financials Slide — Pitch Deck Perfection
In this section of our Pitch Deck Series, we're going to provide you with a killer financial projections slide template that's easy to use and will impress investors.
August 11th, 2022 | By: The Startups Team | Tags: Pitch Deck
Why does it Matter?
The financials slide in our pitch deck takes our own financial projections and consolidates them into our most key metrics that potential investors care about.
Most pitch deck financial projections wind up being incredibly hard for potential investors to understand, so we're going to provide you with a killer financial projections slide template that's easy to use and will impress investors.

Key Metrics Potential Investors Want
We always build our financial projections slides in our pitch deck backward from what questions investors have.
That way, the financials slide is only covering exactly what a potential investor wants to see — and no more!
"What are the pro forma financial projections?"
Our "pro formas" are really just a forward-looking version of the income statement we consolidate in the financial slide.
Unlike publicly traded companies that have to share financial projections precisely, the financial slide of early-stage startups is more of a rough estimate that we use when raising money.
"What Key Metrics Drive the Financial Model?"
Our financial projections are all driven by a handful of key metrics (we call them "assumptions") that drive the overall financial model.
The way we create killer financial projections is to limit our discussion to just those assumptions in our pitch decks.
This helps us convince investors that our financial plan works without having to muddy up our pitch deck slide with a ton of distractions.
"What's the Operating Income and Margin?"
Potential investors want to see financial models that have a profitable gross margin - eventually!
We've all heard of major tech companies literally losing money while providing wildly optimistic projections to raise money. Yes, that happens, and no, that's not how financial projections work!
The best financial projections may show a short-term loss but eventually, convince investors that our startup can scale profitably.
Financials Projections Slide Template
There's a "secret formula" for the financials slide that isn't actually much of a secret. We simply need to convince investors that the following is true:
Revenue - Expense = Margin
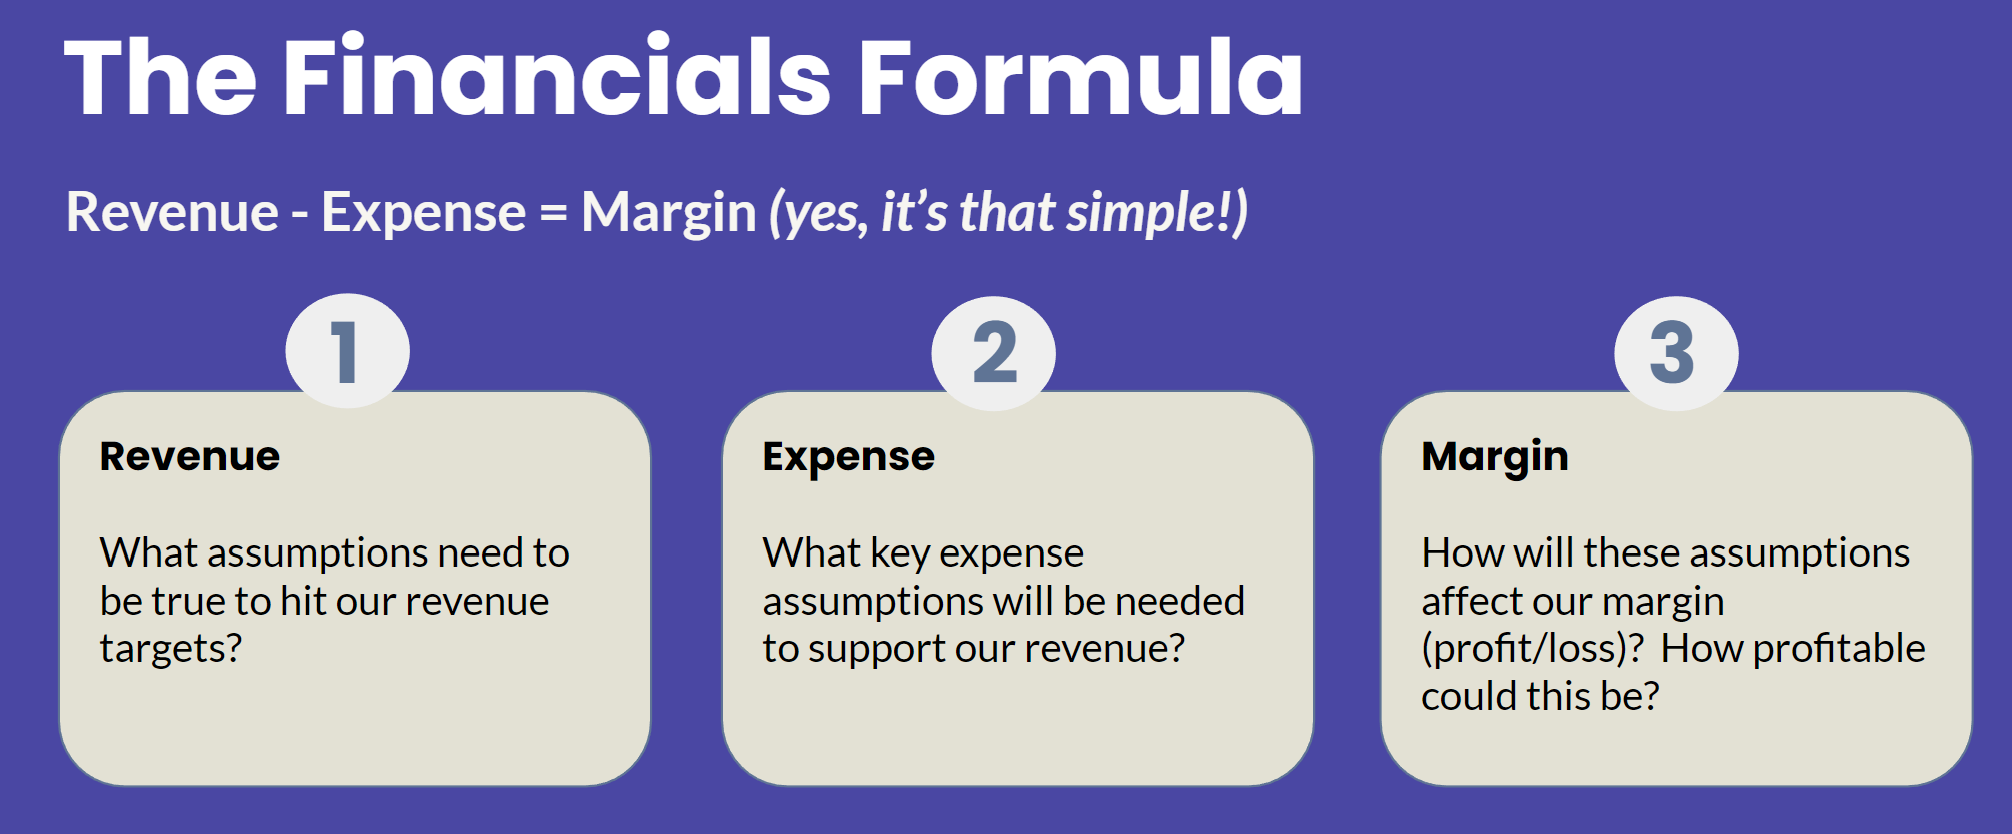
Step 1: Revenue.
What assumptions need to be true in our Sales and Marketing budget to drive our revenue growth targets?
Step 2: Expense.
We take all of the costs to fund growth - direct labor costs, marketing expenses, capital expenditures — and apply them to drive our revenue model.
Step 3: Margin.
We simply take our total revenue minus cost and get our margin.
Apply the formula:
Now that we understand the formula in the financial plan of our pitch deck slide let's get started understanding financial projections and how to populate them.
Income Statement vs. Profit and Loss Statement
You'll notice this template ignores investment money, cash flow, and a traditional balance sheet. That's because we're far more concerned about our net income line than our cash position line at any point.
That said, some startups may have a business where their cash flow shows a positive balance on a regular basis based on the model — and that's fine.

Assumptions vs. "Just Math"
Startups typically spend way too much time trying to build their first financial projections because they are going about it all wrong.
They assume that potential investors want detailed financial information about every aspect of their startup.
Instead, we make everyone's lives easier by building our own financial projections slide with just a few "key assumptions" that will drive the whole financial model of the pitch deck.
Defend Assumptions, not Math
That way our conversation with investors is about those key assumptions — the rest of the model is "just math" (meaning the assumptions drive the math of the financial model).
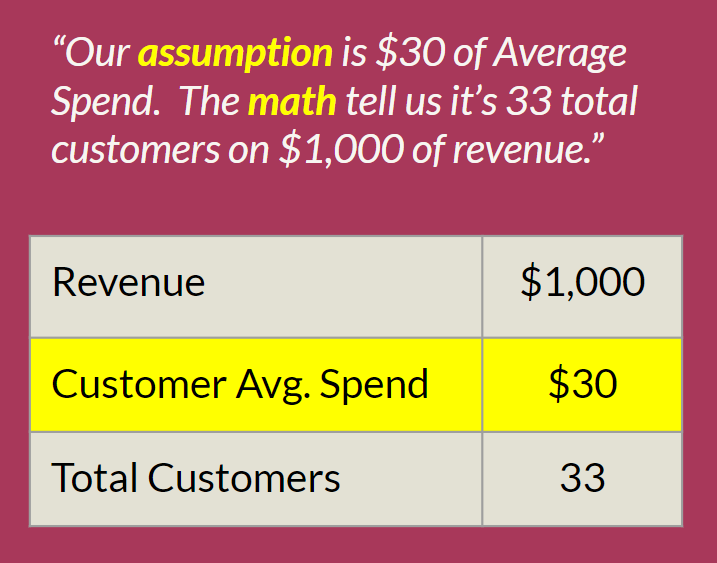
In this example of our annual recurring revenue, we see the key revenue driver is "Customer Avg. Spend" of $30. Therefore if we want $1,000 of revenue, we'll need 33 customers. The assumption is the $30 — the rest is just math.
Calculate Revenue Targets
We always begin the financial model of our pitch decks with Revenue Targets.
As you'll see in the financial projections template we're building, once we allocate a certain amount of revenue in our financial plan we can work backward to subtract operating expenses so that it equals gross profit. This is really just basic accounting.
Pick Key Revenue Assumptions
We only need a few key revenue assumptions to drive our financial models. We can start with a top-line revenue target (in this case $1,000 in Year 1) and work backward to find the direct costs attributable to this target or in some cases the multiple revenue streams if we have them.
In our example below we want to target $1,000 in Year 1 revenue and therefore we have 1 or 2 key assumptions, we can use for our financial model.
We can choose "Average Spend" per customer ($30) which would require 33 Total Customer to generate $1,000 in Revenue, or we can do the opposite (start with Total Customers to determine Average Spend).
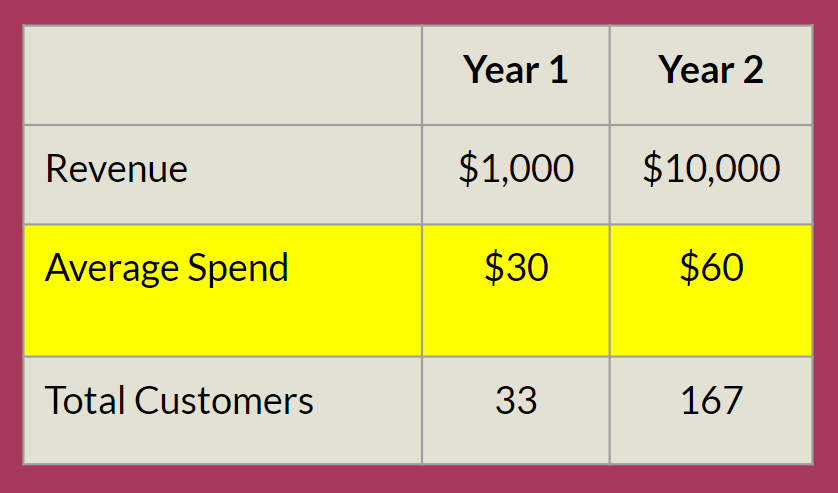
Either way, we're using a single Key Revenue Assumption to drive the financial models for paying customers in our business.
In the event we have multiple revenue streams, we would break these out individually in our financial slide of the pitch deck.
Expense Categories
A typical income statement will have quite a few expense categories but for our example, we are going to combine our own financial projections on the expense side to use 3 categories:
-Acquisition Costs.
How much will it cost to acquire a customer? (Marketing, Sales)
-Costs of Goods Sold (COGS).
What costs are involved to deliver each sold unit? (Inventory, Sometimes People)
-Operating Expenses.
Everything else. (Salaries, Rent, Software, Support, and Training Teams)
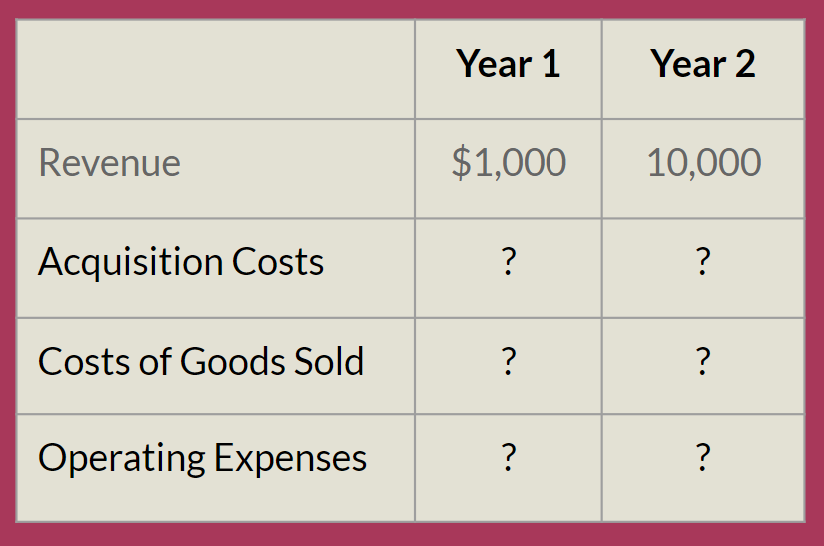
Your business may have your operating expenses divided into different categories or you may place something like your training team cost in COGs or your raw materials labor costs in Operating Expenses but both the expenses will ultimately be represented here.
Acquisition Costs
We tend to start with the Acquisition Costs in our income statement because they tend to drive our revenue projections in the pitch deck most directly.
Ultimately we want the financial slide in our pitch deck to highlight our acquisition costs.
Frequently Used Acquisition Costs
When startups go to raise funds they tend to get asked about the same handful of metrics in their pitch deck slide:
Cost Per Acquisition (CPA)
The cost to acquire non-paying customers such as a site visitor or someone walking into a retail location. Often associated with things like our Google Adwords spend or social media spend.
Customer Acquisition Cost (CAC)
The cost to acquire paying customers blends the cost of all of the non-paying customers as well. This blends all of our channels into a single cost which provides the best indicator of what it truly costs to drive revenue.
Sales Commission
This varies in pitch decks based on how the acquisition model works for example direct sales that don't involve a marketing budget. We may include a commission that we pay per sold unit or an affiliate fee that we pay to a 3rd party. We can be pretty broad with this.
The Math of our Financial Plan
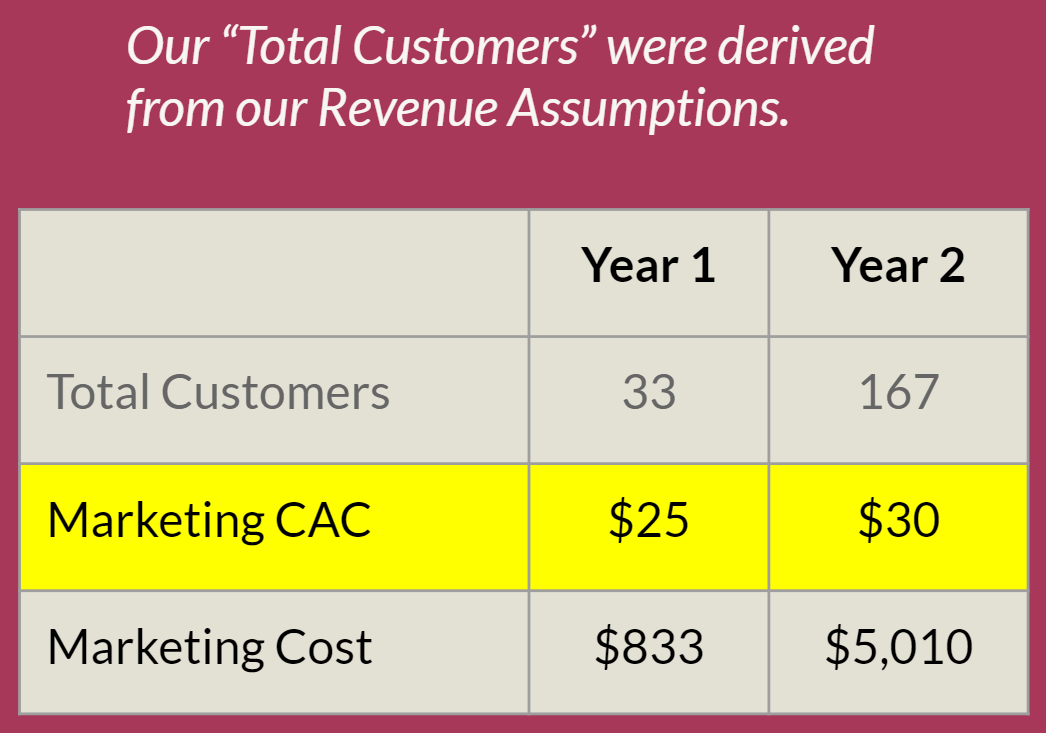
Now let's start running a little math! We're going to inherit the "Total Customers" from our Revenue forecasts (33) as a constant. The only variable we'll introduce will be our new marketing assumption "Marketing CAC = $25."
Now we multiply "Total Customers" (33) x "Marketing CAC" (25) to derive our Marketing Cost of $833. If an investor understands our Revenue Assumptions then all they need to understand is a single Marketing Assumption ($25) to agree on our total Marketing Cost — magic!
Cost of Goods Sold
Our financials slide may not have a "Cost of Goods Sold" (COGS) in their pitch deck because there is no additional cost to produce each unique unit we sell.
This is generally reserved for physical products, however, some products may include unit costs for delivery in their pitch deck such as how Uber pays a fee to drivers for every unit of rides sold.
Typical Cost of Goods Sold Categories
There is no hard and fast rule as to which items will be our Cost of Goods Sold but an easy way to think about is this "What costs would be required for us to sell another unit?" Things like rent or production environment salaries do not apply, but here are some examples that do:
Cost of Sales
As an assumption, we can apply a percentage of Revenue that will be charged for each sale, similar to the percentage example we used for Uber in every ride they pay to drivers.
Processing Fees
Most businesses use credit cards to process fees and therefore have a small credit card processing fee of around 3% for every transaction.
Cost of Goods Sold
In the example for our pitch deck below, we're representing "Cost of Goods Sold" as a total of costs, so this would include our categories above.
Revenue Drives Cost of Goods Sold
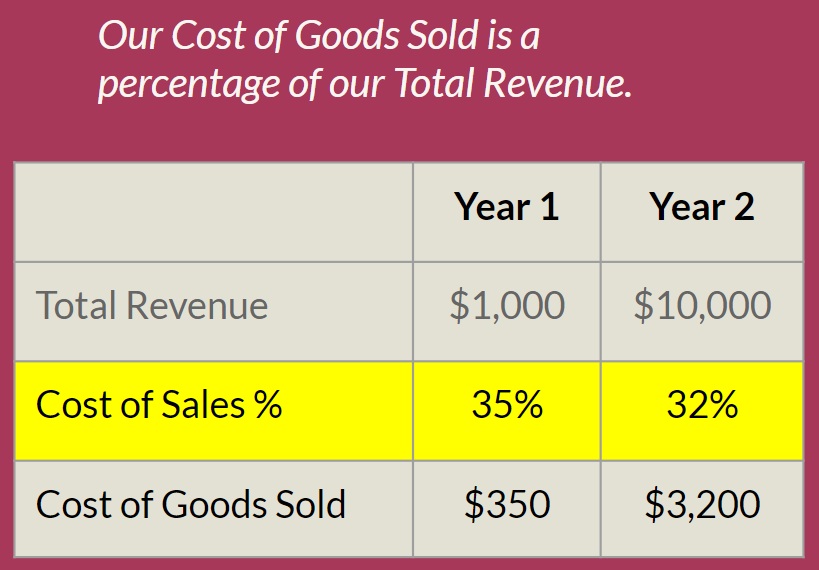
Once again notice how our target revenue of $1,000 is driving the other line items in our financial plan.
Our assumption for the pitch deck is that our "Cost of Sales %" of 35% will generate $350 in Cost of Goods Sold. Once again, a single assumption in our financial plan drives the pitch deck.
Operating Expenses
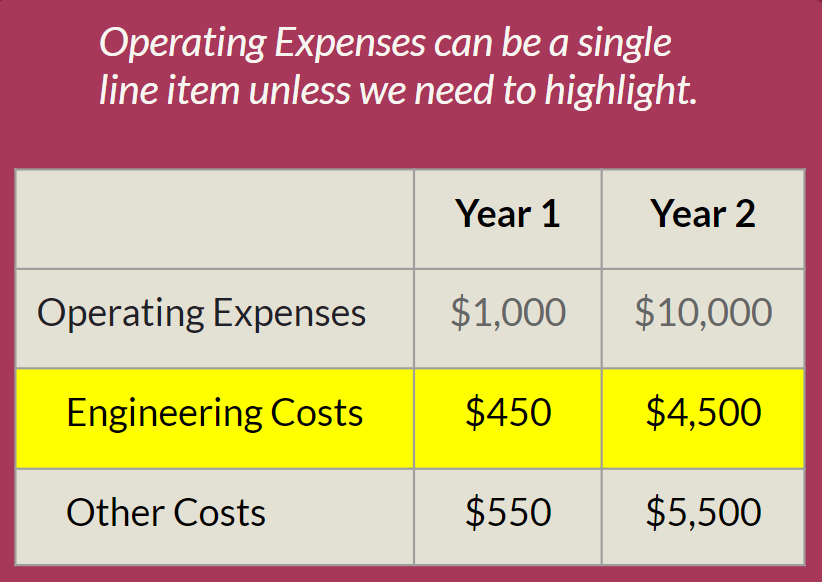
The most populated part of the financial slide in our pitch deck tends to be our Operating Expenses. These tend to be our Fixed Costs that do not change based on Revenue volume.
Sure, they grow over time, but unlike our credit card processing fees or some other Cost of Goods Sold, they do not specifically change with each new transaction. If they do, we should move them up to our Cost of Goods Sold calculation.
Most Common Operating Expenses
Salaries
All compensation of staff, (including contractors who we don't pay taxes for) benefits, bonuses, and employer taxes.
Rent/Office Costs
All office-related costs such as rent, Internet connectivity, and most equipment.
Software & SERVICES
All recurring services that help run the business such as Slack, Dropbox, or Gsuite. If there are other services that aren't software add them here.
Everything Else
Our financials in the pitch deck don't need every last detail just the categories that are most important, so it's fine to combine all remaining costs assuming they are not a major contributor. If so, break them out into a separate line item.
Gross Margin vs. Net Income
Once we've plugged in our Revenue, COGS, and Operating Expenses into our financial model of the pitch deck, we can now forecast both our Gross Margin and our Net Income.
What is Gross Margin?
Gross Margin (or Gross Profit) is sometimes represented slightly differently in each business depending on the nuances of this business. But a good use case for most startups will be to represent the amount of income the startup makes before Operating Expenses.
This is particularly important for startups that have a strong focus on the Unit Economics of the business.
For example, if we're selling pizzas, it helps to know how much we make per pizza before we worry about all the other costs to run the restaurant.
That's because investors know if we can't make a profit before we factor our regular Operating Expenses in, then our business model simply doesn't work and our pitch deck gets thrown in the trash!
Gross Profit Example
Gross profit is actually easy to calculate. All we need to know is our Total Revenue ($1,000) and subtract our Cost of Goods Sold ($350) which would yield a Gross Profit of $650.
Investors will use that gross profit number to determine if the company can generate enough volume in each transaction to cover Operating Expenses and make a big fat profit someday.
Net Income Example
On the other hand, we have Net Income. Net Income is the actual profit of the business after we combine multiple revenue streams, then subtract COGS and Operating Expenses.
In our example below we've combined all revenue, and all expenses (COGS and Operating Expenses) to look at our Net income, which like most startups — is negative!
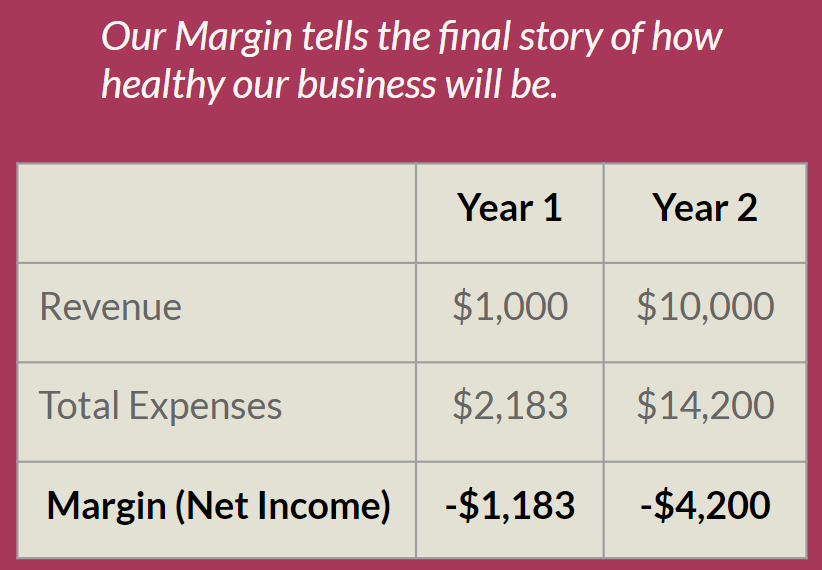
While providing a Gross Profit / Gross Margin line item is optional, providing a Net Income line item is absolutely required. And again, it's very common that our numbers will be negative for a while — that's why we're raising money!
Sample Financials Projections Slide
Here's an example of a financial projections slide with all of our projected growth. In this case, we kicked off the pitch deck slide with a single declarative statement "We anticipate being profitable within 36 months."
This is a great way to summarize what we want investors to take away from the slide so that they aren't guessing as to how to process what we've presented. We always want to control how the investor processes our pitch deck on every slide.
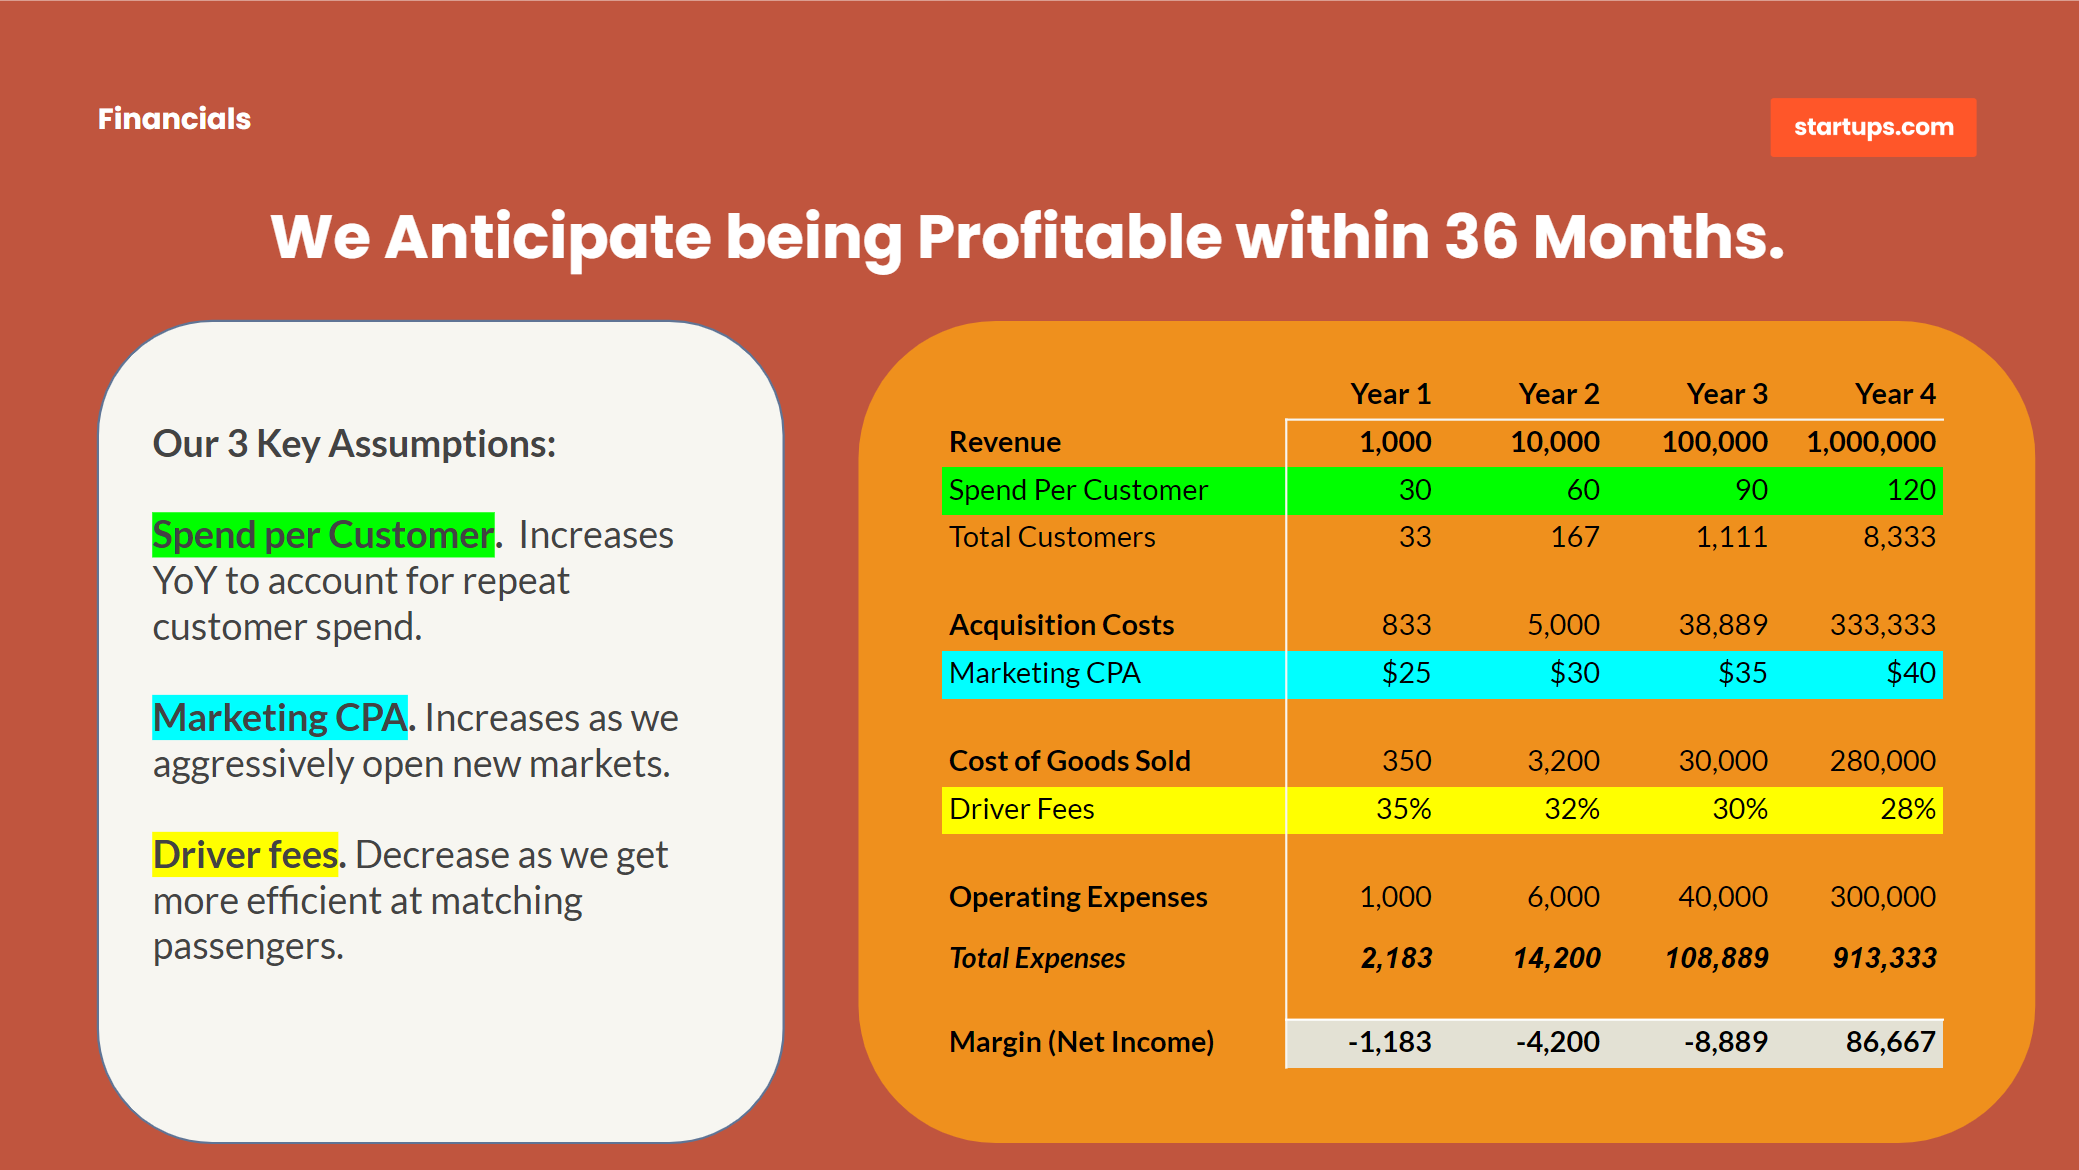
Notice how we're presenting two things here - the Key Assumptions that we used to generate the forecasts and only enough summary information to understand the parts of the pitch deck slide that matter.
Investors may in fact want more detail later, but right now they simply just need the summary data to understand that we are in the "right ballpark" for the type of startup pitch deck they are looking for.
Common Pitch Deck Mistakes
This is probably our first pitch deck and likely the first time you've built out and presented your financials to investors — it's everyone's first time — so don't worry!
Along the way though let's avoid a few of the most popular pitch deck mistakes that most Founders make:
Don't say "Conservative Estimates"
Founders love to tell investors that these are "conservative estimates" and the "real numbers" will likely be much higher.
Investors aren't looking for conservative estimates they want our best estimates that we are willing to defend.
Avoid Unnecessary Detail
Strip out an additional cost or category unless it directly relates to understanding the overall financial model. Less is more here.
We're more likely to get tripped up by adding too much information than getting a request for more later.
Expect Losses
Nearly every startup suffers significant losses in the early days before it becomes profitable - don’t sweat it!
A startup pitch deck is synonymous with losses - what matters is our road to profitability.
Ignore the Balance Sheet
Investors aren't expecting a Balance Sheet in a pitch deck unless there is something very specific about the business model where the balance sheet matters.

Final Thoughts
The financial section of our pitch deck is often the most confusing slide because it not only requires a significant understanding of finance and accounting but it's the one thing we can't just "make up as we go" (although many startups have tried!)
Remember that investors know that our pitch decks are reflective of the formative stages of our company and aren't expecting everything to be perfect. They also don't expect a full-grown company — or a profitable one — yet.
Our pitch deck should serve as a roadmap to our vision and our financials should serve as the support mechanism to pay for that vision. Both will change dramatically over time, so right now we should just be focused on starting the journey.
About the Author
The Startups Team
Startups is the world's largest startup platform, helping over 1 million startup companies find customers, funding, mentors, and world-class education.
Related Articles
Unlock Startups Unlimited
Access 20,000+ Startup Experts, 650+ masterclass videos, 1,000+ in-depth guides, and all the software tools you need to launch and grow quickly.
Already a member? Sign in