Startup Finance: 3 Assumptions That Matter
Financial projections determine whether our startup will survive, thrive, or take the dreaded deep dive — so we really need to suck less at creating them!
October 4th, 2022 | By: Wil Schroter | Tags: Funding
Startups live and die by financial projections — yet we tend to suck at creating them!
That's because we're so busy trying to create the "perfect" financial statements, when in fact what we should be working on is identifying what key assumptions will drive our projections at all!
Assumptions are the raw materials that make up our financial statements and tell us whether we're headed toward gross profit or total disaster! Here we'll be taking a beginning inventory of the 3 most important financial assumptions that tend to drive most startup company projections.
Assumption #1: "How Many Customers Will We Acquire?"
Our first step is to construct a series of assumptions that tell us how many paying customers we will get through the door. All of these estimates we're about to make on business expenses or overhead costs are just placeholder estimates.
We likely won't know the actual values until we're up and running, and even then we'll constantly modify them as we learn more.

The Goal is "Conversions"
Our goal in this exercise is to determine how many “conversions” translate to a paid customer. A “conversion” is just a general term to mean that some potential customer has expressed interest in our product — it could be leads, sales, trials, installs, test drives, or whatever translates into sales volume for our business.
What’s important is that we can take this Final Value (we’re using “Total Conversions” in this example) and multiply it by our Average Sale Price in the next step to generate a Total Revenue estimate for the business.
How to Calculate "Total Conversions"
In order to get to “Total Conversions,” we must build up a list of assumptions that lead to that number.
Let’s assume that our business relies on driving traffic to our website to generate sales.
In this case, we’ll assume that sales happen directly on our website. If they didn’t, we might add some additional assumptions to determine how many customers convert later in the process, but ultimately, we want to know how many paying customers we will have.
How many Visitors will our Budget Generate?
Here’s the list of assumptions we’ll use. We will input values in bold – the rest is just a calculation. We'll explain each line item one by one.
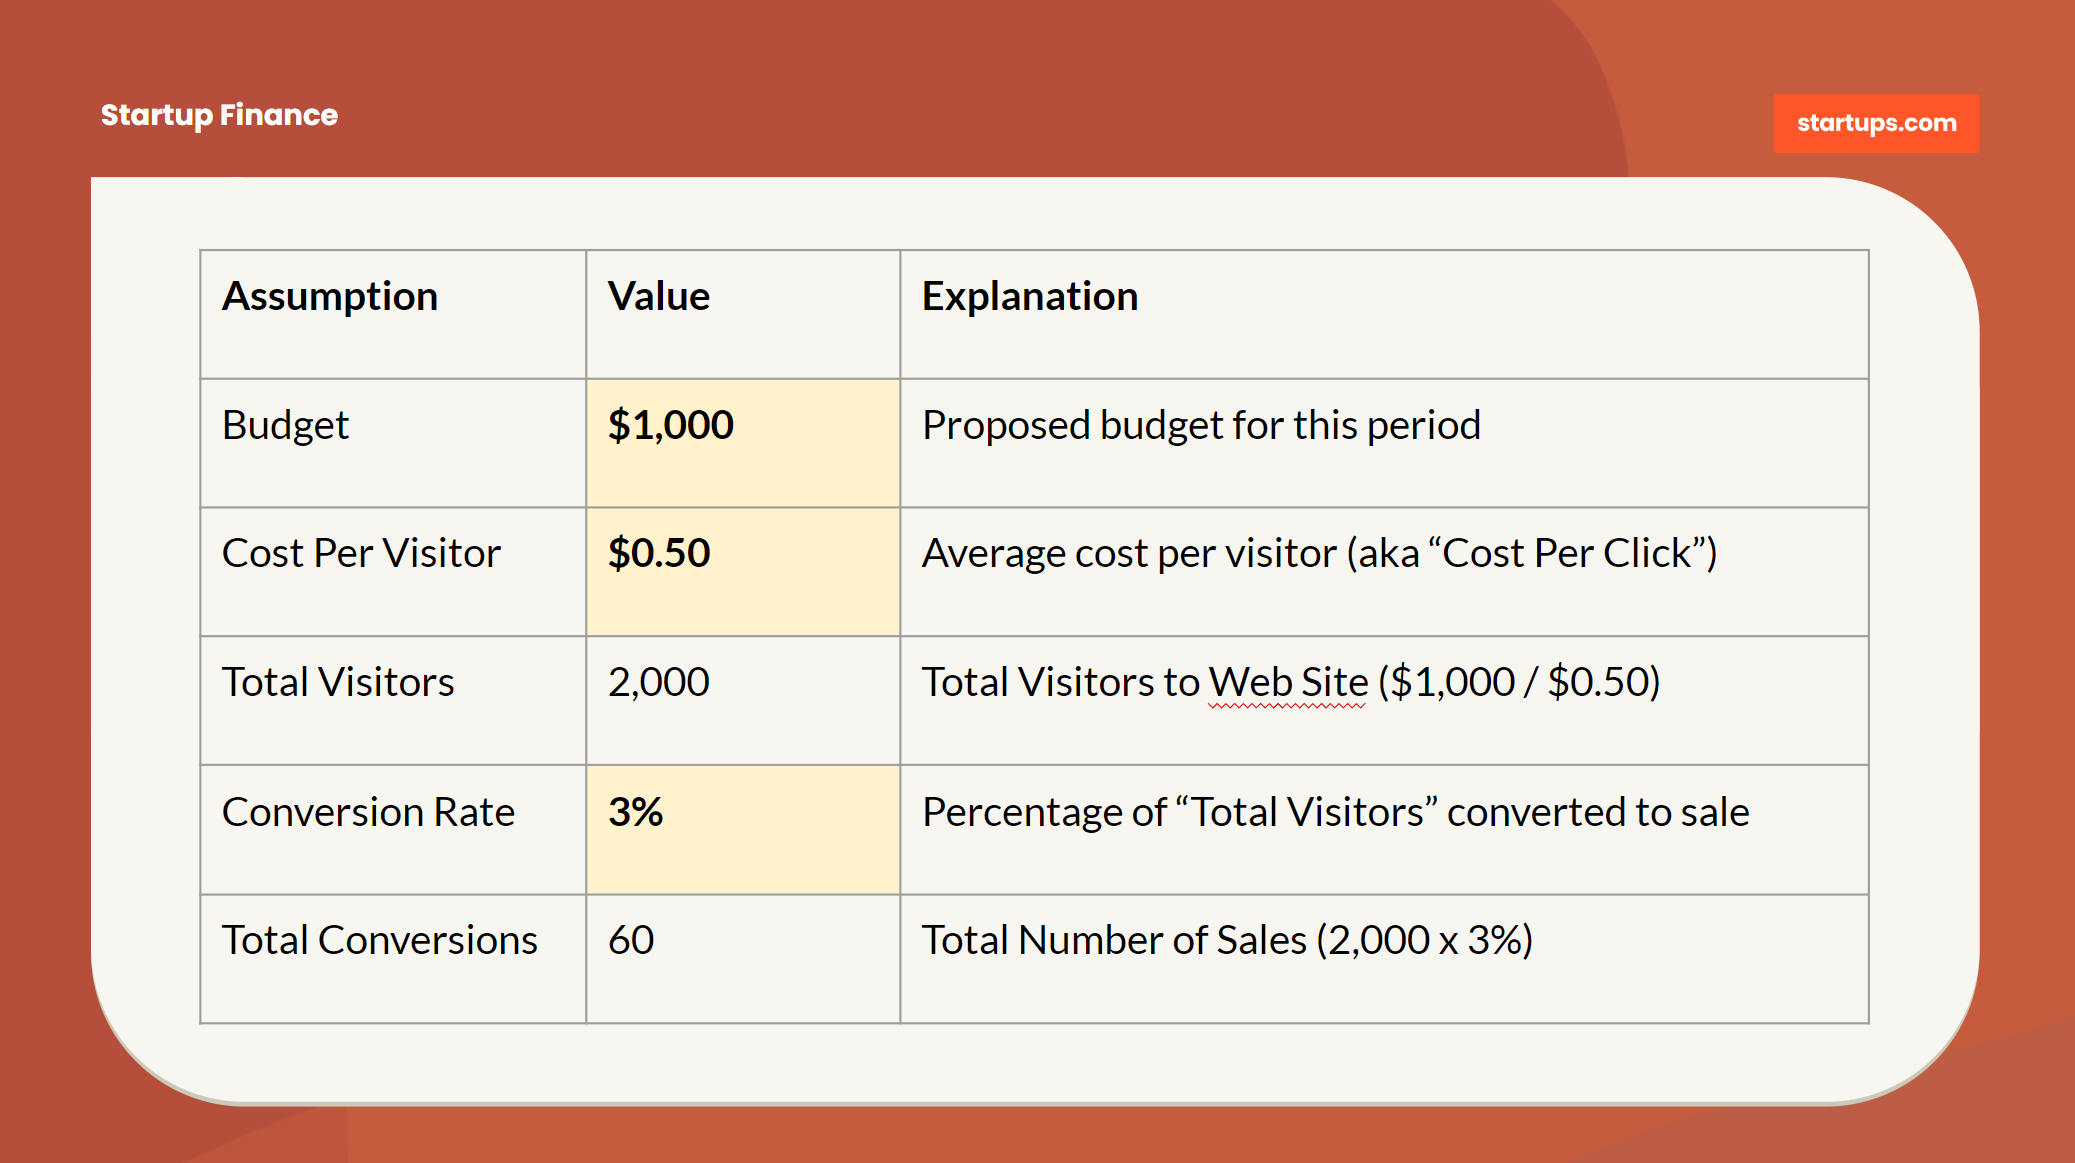
According to these assumptions, if we spend $1,000 on marketing, we’ll generate 60 paying customers. Let’s walk through each of the assumptions one-by-one to figure out why we chose these specific values and how to modify the exact cost to our own tastes.
Budget
What we’ve done is start with a budget of $1,000. That’s arbitrary.
We can drive that number based on how much capital we have to spend or just use a placeholder, for now, to see how the math plays out. We're assuming there will be some level of business expense for marketing to drive customers.
Cost Per Visitor
We’re going to be buying ads via Google Adwords. Adwords can predict for us how much an average click will cost so that we can get a placeholder value. (Take a look at Google’s Keyword Planner tool for more info on this).
The “Cost per Click” will be a really important metric going forward because our budget is relatively fixed – but our cost per visitor can swing heavily in either direction.
Total Visitors
There’s no assumption here – just math. We divide our Budget ($1,000) by our Cost per Visitor ($0.50 cents) to get our Total Visitors (2,000).
We still don’t know if any will turn into paying customers – that’s the next step.
Conversion Rate: What % Become Paying Customers?
Now that we know we’ve got 2,000 Total Visitors, we need to build an assumption around how many of those will turn into paying customers.
Conversion Rate
What percentage of website visitors will turn into paying customers? (“How the heck should I know?!” we might ask) That’s the million-dollar question.
The truth is we don’t know that answer until we have enough data to support it. What we need to do is insert a starting value (we used “3%”) to generate our Total Conversions (to a sale). We’ll get back to this in a minute. All that matters now is that we agree the number is crazy important.
Total Conversions (to sale)
This is the big payoff – and again it's just math. All that is happening here is we are multiplying the Total Visitors (2,000) by the Conversion Rate (3%) to get 60 Total Conversions to a sale.
Let's Review the Outcome
In this model if our assumptions hold true, $1,000 of ad spend will generate 60 paying customers. What’s more important is what we can do with these assumptions going forward.
Instead of saying “I don’t know how many customers we could possibly get!” we can say this:
If we spend $1,000 and have a $0.50 cost per click – we will absolutely have 2,000 Total Visitors.
If 3% of our visitors convert to paid – we will absolutely have 60 paying customers.
All we have to be concerned about is getting to a $0.50 Cost per Click and a 3% Conversion Rate. The rest is just math. All of our time will be spent trying to manage toward these assumptions.
Assumption #2: "How Much Will Customers Pay Us?"
Now that we have some assumptions set up to tell us how many paying customers we might get, the next step is to figure out how much they might pay us. This begins the fun and fanciful journey of determining our LTV – or Lifetime Value.

The reason LTV is so important right now (even though we have no idea what it will ultimately be) is that it drives so much of the rest of our model.
Example: Pizza by "Joey B"
As an example, if our customer – “Joey B” – buys a single pizza from us for $15 and never buys again, we know we can never spend more than $15 to acquire him as a paying customer.
But if our friendly pizza-loving Joey B were to buy 3 more pizzas – we’d have $60 of total revenue – which would give us more of the company's gross profit margin to play with to acquire him.
So, it’s not just about a single purchase that drives our business model, it’s about the entire value of all a customer’s purchases.
We often only pay to acquire a customer once (think NetFlix) so the larger our LTV grows over time, the more potential marketing budget we could have to acquire more Joey B's.
Calculating LTV
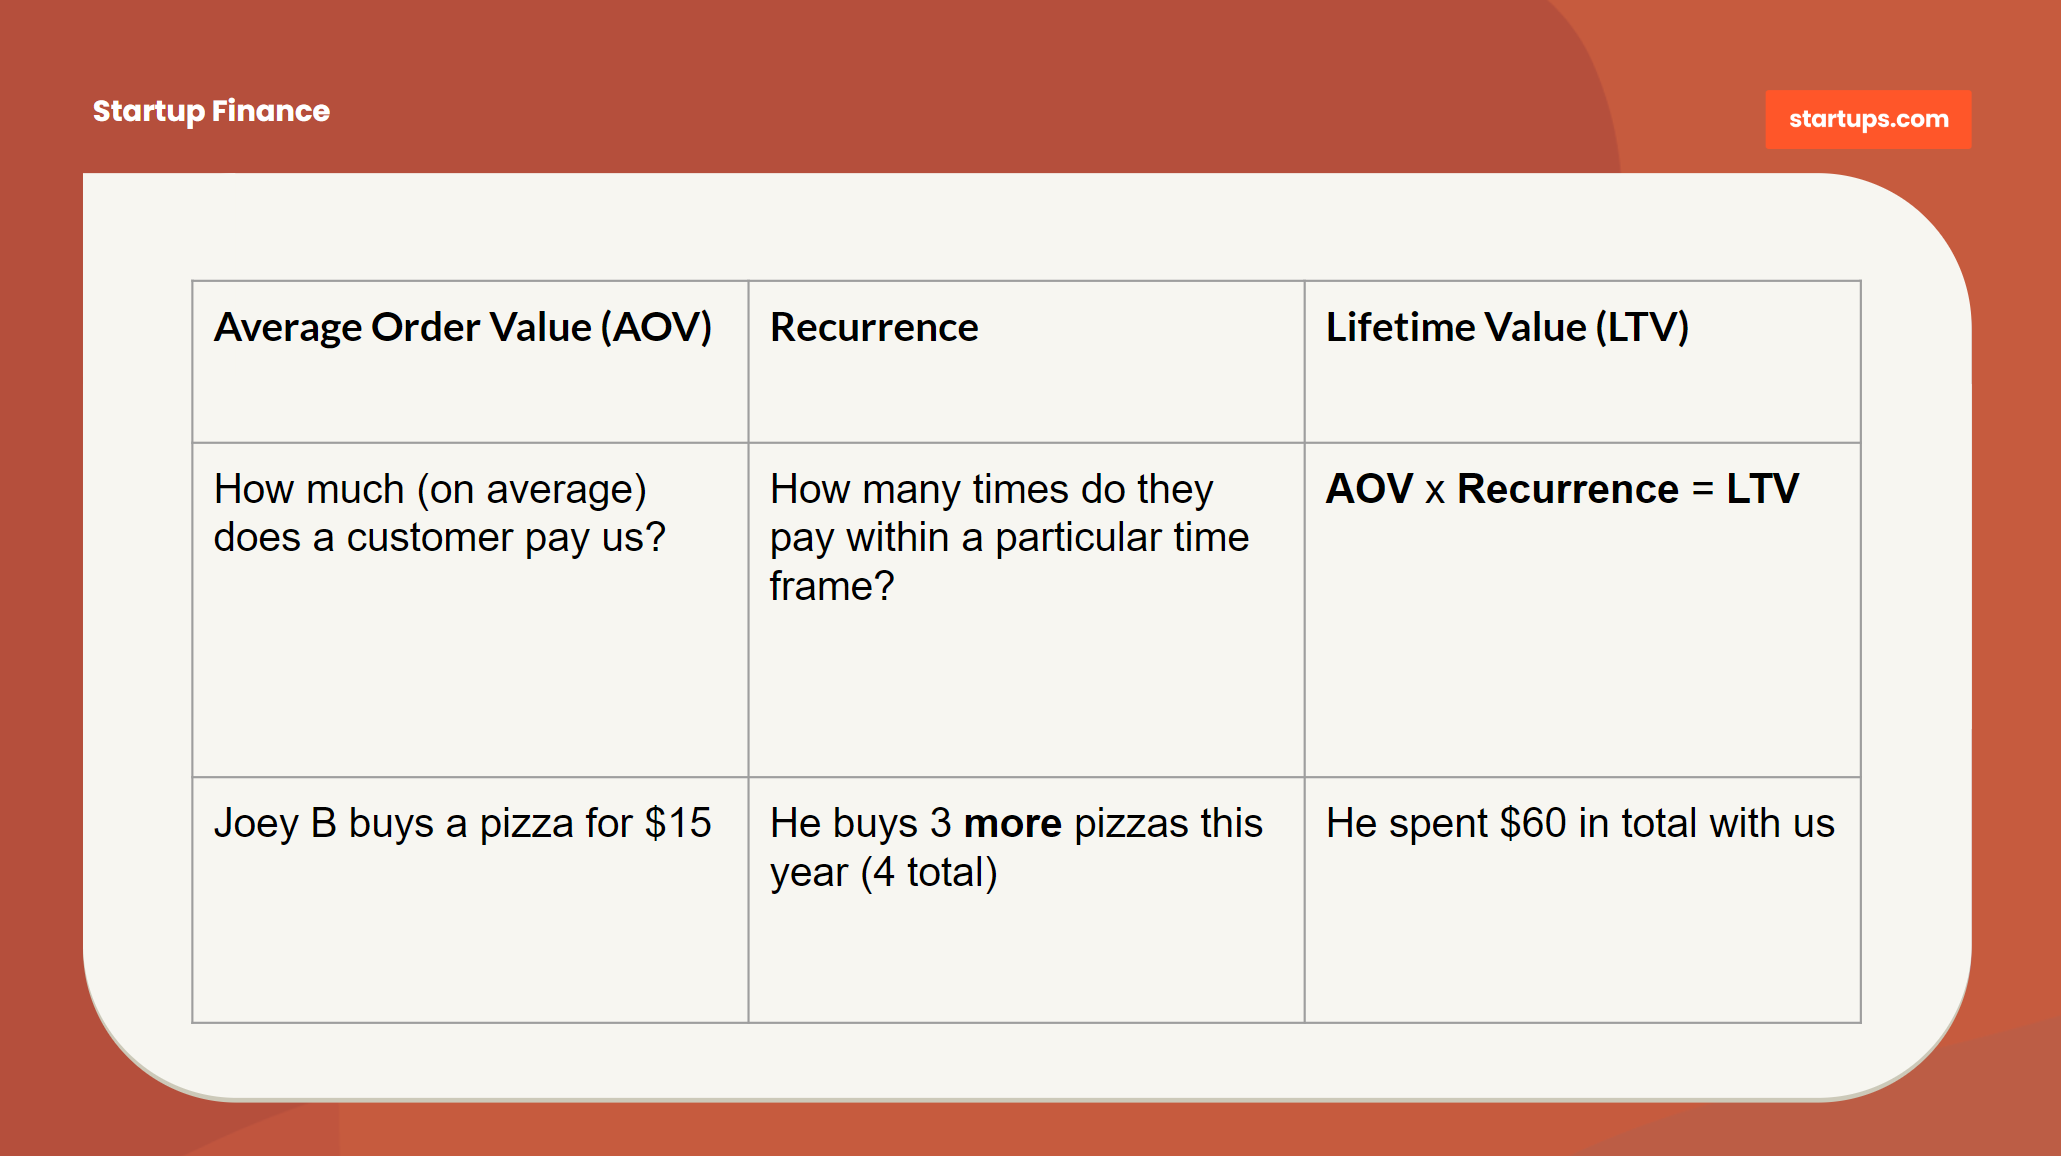
In order to calculate the total value of a paying customer (LTV), we just need to know the average amount they will pay us, multiplied by the number of times they will pay us.
Average Order Value (AOV)
Our first step is to determine our Average Order Value (AOV), which means what the average customer spends with us per transaction.
Purchases prices may be different over time (like apparel) or they may be fixed over time (like a subscription product). In either case, we'll simply start with an estimated value to begin with and modify that value as we learn more about purchase value behaviors.
In our example, we're starting with an AOV of our pizzas of $15. It's an assumption, and we expect it to change over time.
Recurrence
Recurrence is the number of times a customer will purchase our product again. Most businesses have recurring customers, and many business models rely on recurrence in order to get the full value out of their customers (and pay for the costs of servicing them)
Netflix is a great value at less than $15, but if every customer only paid a one-time fee of $15, the business would die a quick and painful death! Therefore, Netflix relies on customers to keep paying month over month (recurrence) in order to cover their initial costs to acquire the customer, and of course, the ongoing costs to pay for content and the operating parts of the business.

What if we don't have Recurrence?
Some businesses don't recur at all. For example, a consulting business may only drive single engagements with clients and that's it. Our financial planning would be limited to that single payment using typical one-year accounting methods.
How to Forecast Recurrence
If we've never operated our business before, all we need to do is use a placeholder value - an estimate. If we estimate someone will buy 12 pizzas per year and we later learn they only bought 4, we will adjust as we go.
We may come to this conclusion:
The average customer will likely buy a pizza from us once every other month. Some will buy a couple of times per month and others will only purchase one pizza ever, but we’re estimating that our average customer will buy about 4 pizzas per year. Our recurrence is 4 units.
What's important is to remember we are monkeying with placeholders - not foretelling the future. We're startup Founders, not Nostradamus.!
Lifetime Value (LTV)
If we know how much our customers pay on average (AOV) and we know how many times they will pay us again (Recurrence) – then LTV is just simple math:
Average Order Value ($15) multiplied by Recurrence (4) = Lifetime Value ($15 x 4 = $60)
Note that we count the first order as “recurrence” as well. If the customer purchased just one time, the “recurrence” value would be 1.
What LTV Tells Us
Now that we know our average customer will yield us $60, we can use that information as the foundation of our financial forecasting.
How much we can spend on marketing
If we know that our LTV for a customer is $60, then we know for sure that our cost to acquire a customer cannot exceed $60. In fact, it must be much lower to account for the cost of the goods sold (COGS) as well as the operational expenses of a company. But now we have an upper limit that will allow us to manage our marketing budget.
How Recurrence may have a major impact
We may find that the rate at which we lose customers (also known as “Churn Rate”) has more impact on our business than the rate at which we gain customers. This may shift some of our focus toward retention strategies that affect pricing, customer service, or modifications to the product to retain customers.
Our maximum top line revenue
The number of customers we sell to multiplied by our LTV is our maximum (“top line”) revenue. We don’t have to guess much from there. If our customer acquisition cost forecast tells us we’re going to get 60 customers, and our LTV is $60, we‘ll make $3,600.
Now that we have a nice handle on “how much will they pay us?” we are ready to move to the third step, which lets us know how much we think the product will cost us – Cost of Goods Sold (COGS).
Assumption #3: "What is our cost of each sale?"
We already know how many paying customers we have as well as how much it will cost to get them. Now we need to make sure we can deliver the product cost-effectively by determining how much our Cost of Good Sold (COGs) is.

Calculating COGS
A company's COGs are the amount it costs to ship a single unit of the product. Before we dig into the cost of goods sold calculation, let’s talk a bit about why breaking out COGS matters, to begin with.
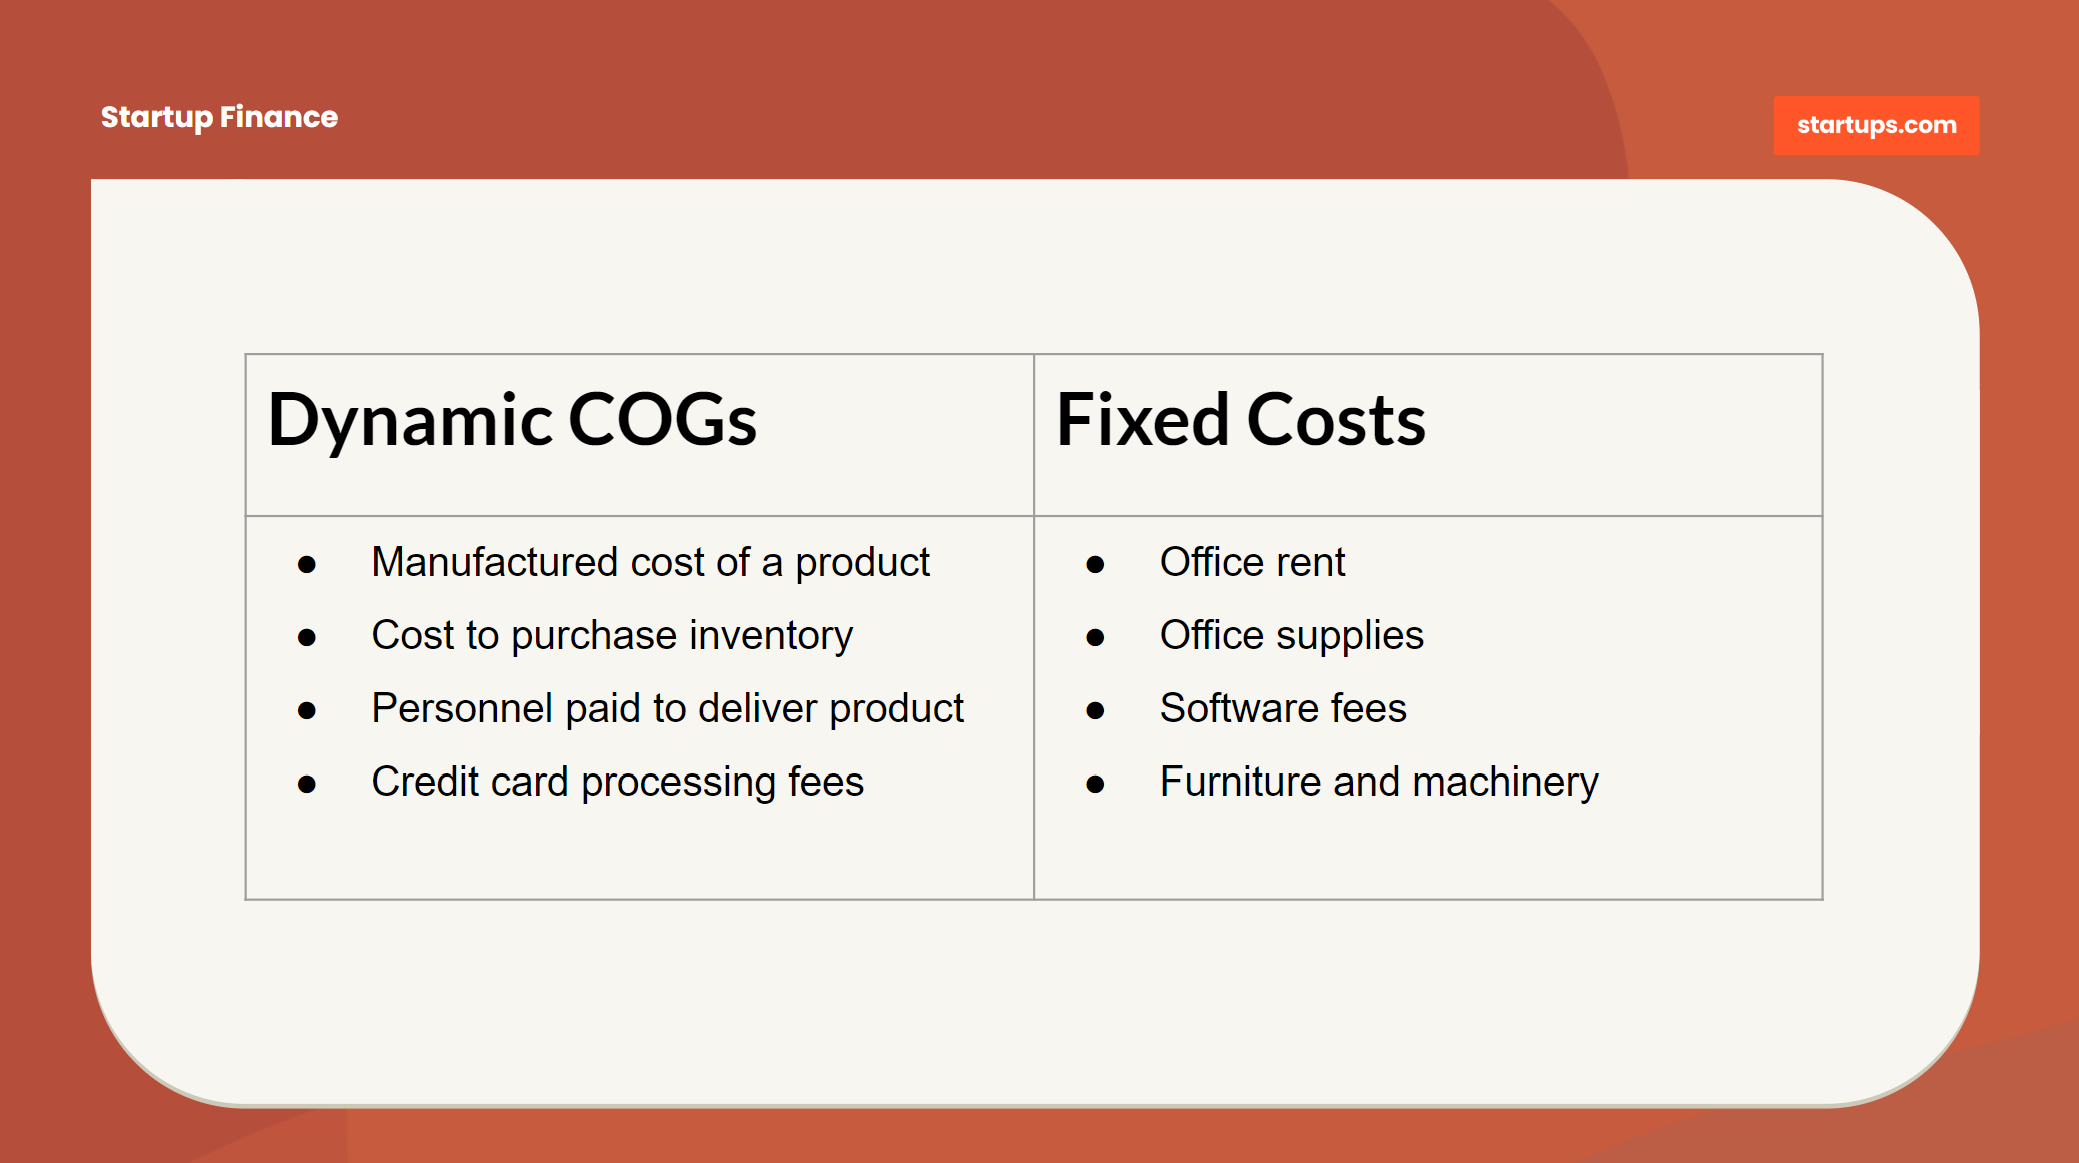
Our goal with COGS is to separate our business costs into two buckets – Dynamic Costs and Fixed Costs.
Dynamic Costs (Variable costs)
These increase every time we sell a product (basically COGS). If we sell 10 more pizzas we need more bread, sauce, and delicious cheese. If we need more resources and raw materials needed for every additional unit, that should be within our Dynamic or Variable Costs.
Fixed Costs
These mostly stay the same whether we sell 0 pizzas or 100 pizzas. This includes things like where we pay rent for office space or fees to service companies (often software vendors).
What if we have no real COGS?
There are tons of businesses that don’t have any meaningful COGS. Most software businesses don’t recognize COGS because the cost of an additional unit of sale is near zero.
If that’s the case, our emphasis will likely be on Customer Acquisition and LTV without having to factor COGS into the equation. Incidentally, it’s also why software-based companies like Google and Facebook seem to "print money" on their Profit and Loss Statement.
Are people (staff) considered COGS?
If our business requires us to pay staff directly to deliver the service, then yes. It's not quite the same as how we think of beginning an inventory of resources, (because it's people) but it still carries the same function.
We don’t want to confuse that with “we pay people to build the product.” If we’re thinking about our pizza place again, the staff isn’t the product. If we sell 10 pizzas or 100 our staff earns the same amount, and therefore while they are making yummy pizzas, the cost of the pizza is the dynamic part we want to capture.
Is marketing considered COGS?
Nope. Marketing is very much a dynamic component to most startups yet we’ll want to keep it separate because it can go up or down regardless of whether we sell anything at all. COGS only comes into play when we actually sell something (or get stuck with inventory!)
If we buy inventory, is the COGS the whole cost or “per unit” cost?
If we pay $1,000 for a case of energy drinks that we’re going to sell, our COGS should still be considered on a unit basis.
So if we sell one drink for $3, and we paid $1 per unit, our COGS that month is $1. That’s for this specific purpose of forecasting and building a basic income statement (which we’ll cover later).
There will be some different accounting that takes place when we need to manage our Balance Sheet which is where we keep track of all of our overall cash costs, regardless of whether we sold anything, and may have a different approach for tax purposes or generally accepted accounting principles.
Example of COGs in Action
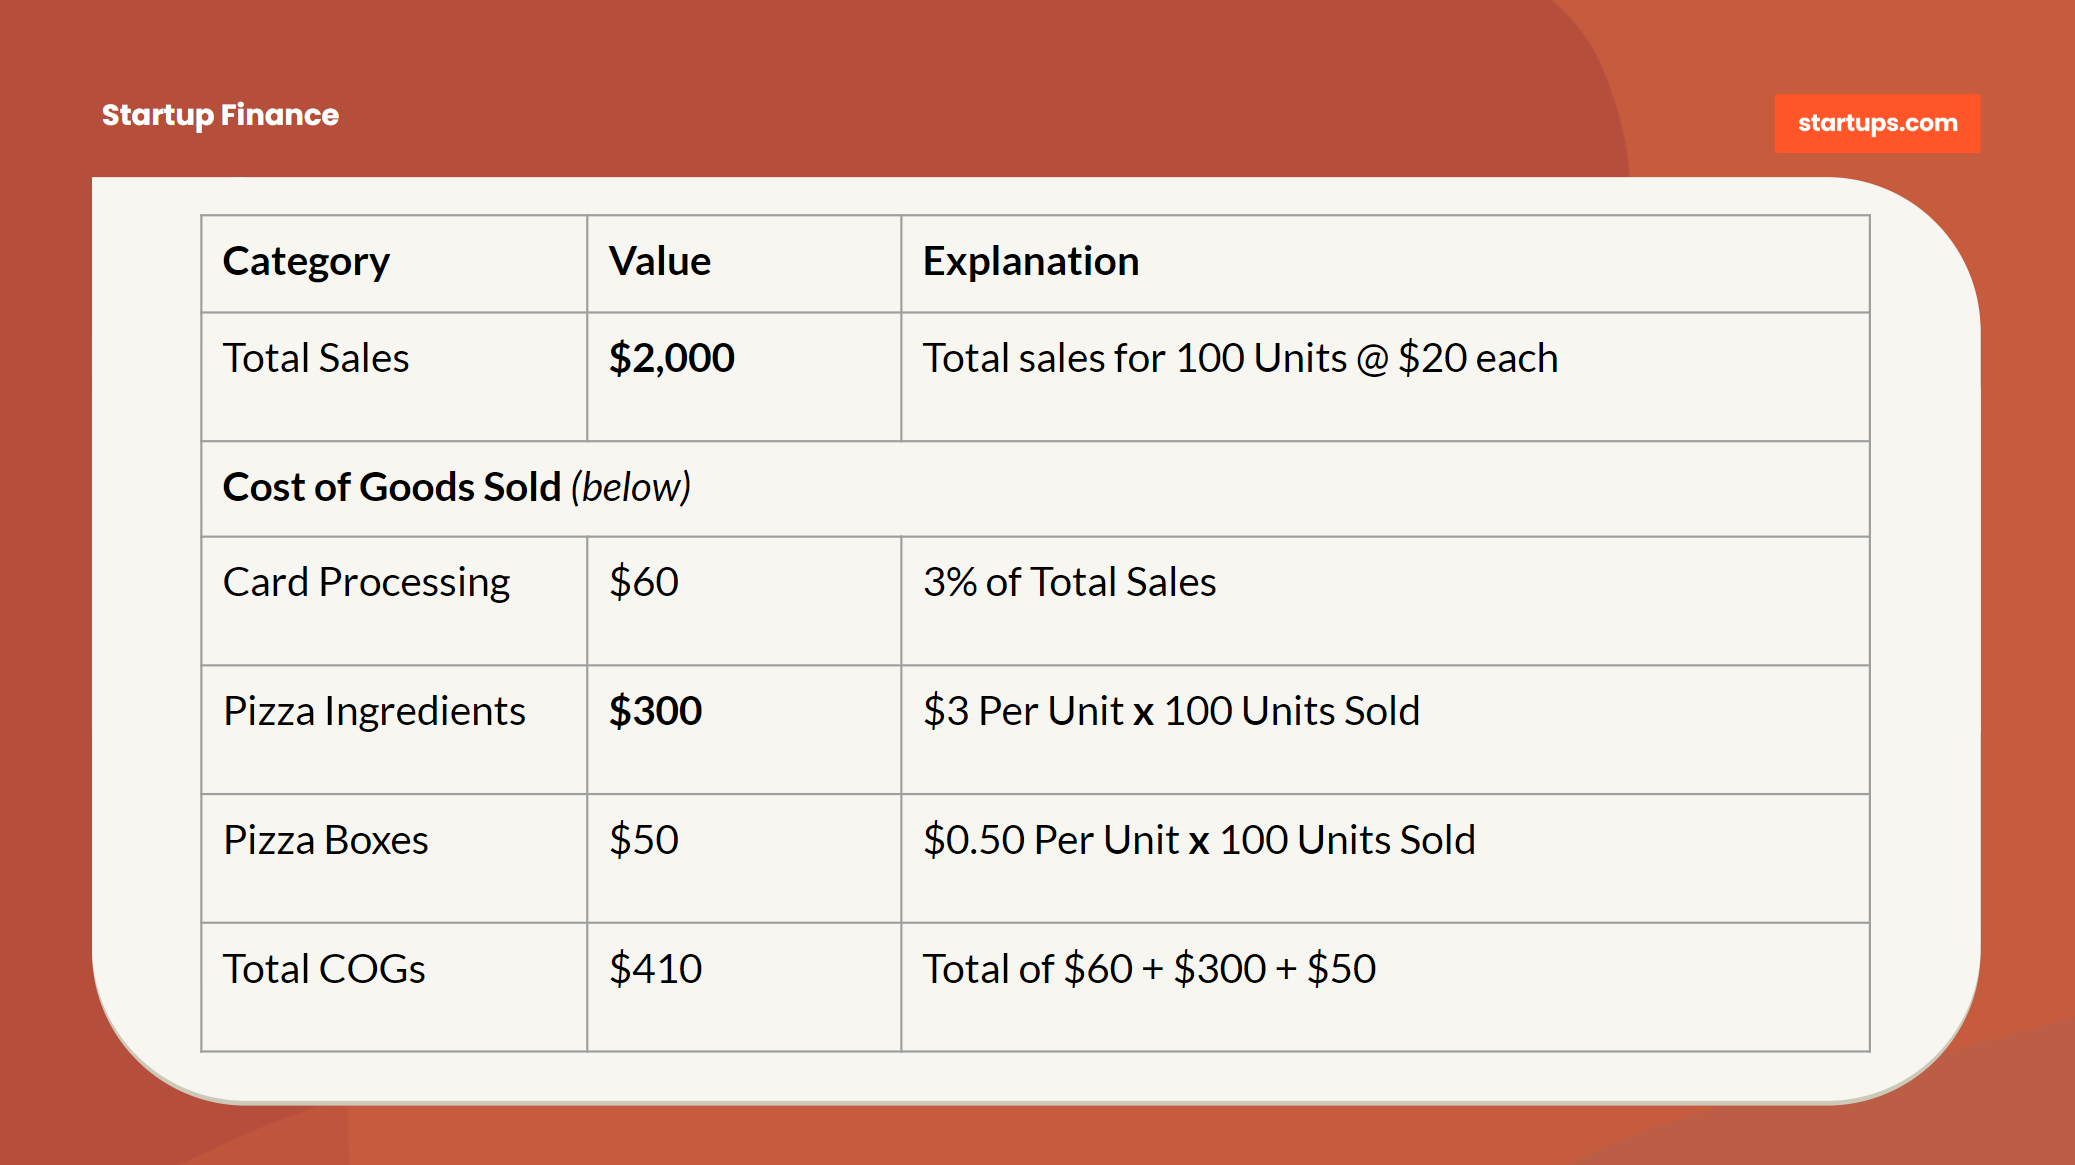
Here's an example of how our COGs scale with the number of units sold.
Total Sales minus Cost of Goods Sold
We just isolated all of our Cost of Goods Sold into a single group which totaled $410. That means we have $1,590 (our Gross Margin) left to cover the operations of the company, which will include fixed costs like staff and office rent and variable costs like marketing.
We separate “Gross Margin” from “Net Income” (how much profit or loss we had) so that we can understand where the sale of our product itself is profitable, before the costs of the company. If it turns out we are selling $20 pizzas at a cost of $25, no matter what – we’re going to lose money!
What About Other Costs?
We can’t entirely ignore how much we’ll spend in staffing costs or what our rent is going to be – that stuff’s important. When we build out our Income Statement in Phase 3, we’ll talk about how to estimate the different aspects of the business.
What we’re really talking about here is isolating “variable costs” from “fixed costs”. Fixed costs we can’t do much about – that’s why they are “fixed”. It doesn’t mean they aren’t an important part of the model, it just means they likely won’t change as dramatically as our variable costs do.
The more variable our assumptions are, the more we tend to worry about them!
Summary
If we were to forecast our business and knew down to the penny exactly what every cost would be, we could make provisions for a big loss by cutting spending, drawing down on a loan, or finding other ways to manage the outcome.
The problem is that we typically have no idea how our forecasts are going to play out, and therefore we have to worry about everything that might be “wrong” with our model. The more variable the assumption, the bigger chance that things can get out of control – which makes it far harder for us to plan for. Therefore, we won’t ignore the other values, we just won’t worry about them as much.
About the Author
Wil Schroter
Wil Schroter is the Founder + CEO @ Startups.com, a startup platform that includes Bizplan, Clarity, Fundable, Launchrock, and Zirtual. He started his first company at age 19 which grew to over $700 million in billings within 5 years (despite his involvement). After that he launched 8 more companies, the last 3 venture backed, to refine his learning of what not to do. He's a seasoned expert at starting companies and a total amateur at everything else.
Related Articles
Unlock Startups Unlimited
Access 20,000+ Startup Experts, 650+ masterclass videos, 1,000+ in-depth guides, and all the software tools you need to launch and grow quickly.
Already a member? Sign in